
caret包
23 May 2014
Data Sets
Visualizations
Scatterplot Matrix
library(AppliedPredictiveModeling)
transparentTheme(trans = .4)

library(caret)
featurePlot(x = iris[, 1:4],
            y = iris$Species,
            plot = "pairs",
            auto.key = list(columns = 3))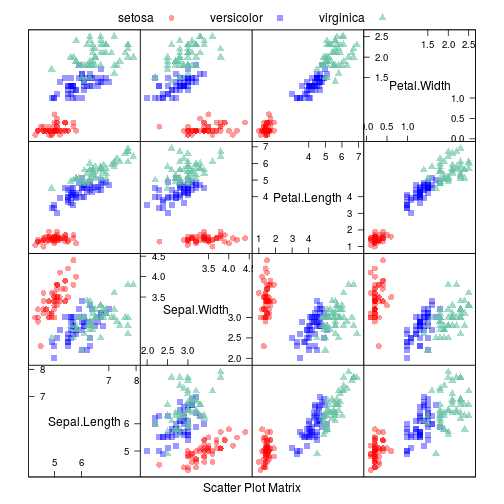
Scatterplot Matrix with Ellipses
library(AppliedPredictiveModeling)
transparentTheme(trans = .4)
library(caret)
featurePlot(x = iris[, 1:4],
            y = iris$Species,
            plot = "ellipse",
            auto.key = list(columns = 3))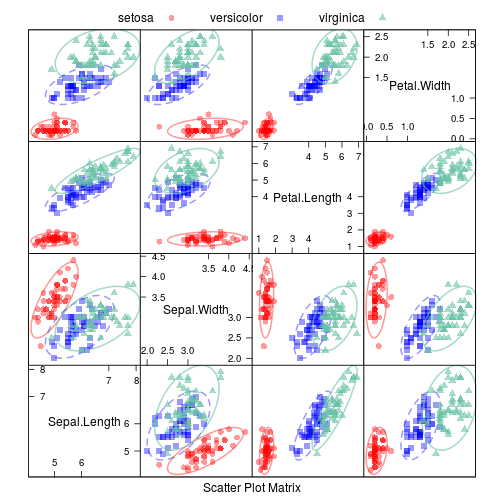
Overlayed Density Plots
library(AppliedPredictiveModeling)
library(caret)
transparentTheme(trans = .9)
featurePlot(x = iris[, 1:4],
                  y = iris$Species,
                  plot = "density",
                  scales = list(x = list(relation="free"),
                                y = list(relation="free")),
                  adjust = 1.5,
                  pch = "|",
                  layout = c(4, 1),
                  auto.key = list(columns = 3))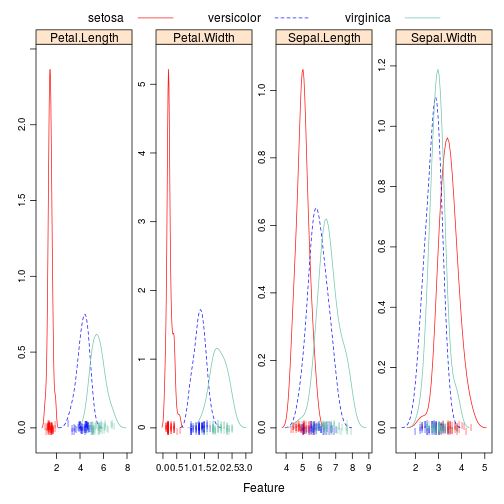
Box Plots
library(AppliedPredictiveModeling)
library(caret)
transparentTheme(trans = .9)
featurePlot(x = iris[, 1:4],
                  y = iris$Species,
                  plot = "box",
                  ## Pass in options to bwplot()
                  scales = list(y = list(relation="free"),
                                x = list(rot = 90)),
                  layout = c(4,1 ),
                  auto.key = list(columns = 2))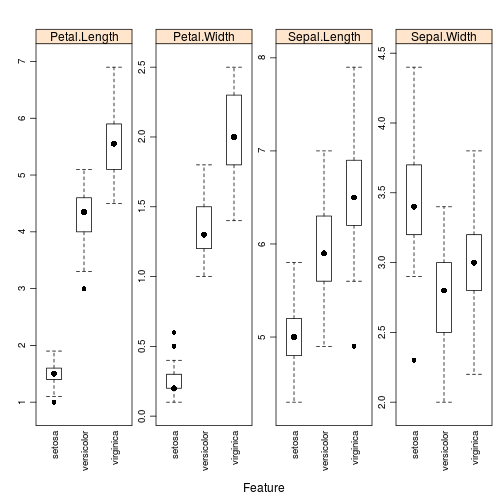
Scatter Plots
library(mlbench)
data(BostonHousing)
regVar <- c("age", "lstat", "tax")
str(BostonHousing[, regVar])
## 'data.frame': 506 obs. of 3 variables:
## $ age : num 65.2 78.9 61.1 45.8 54.2 58.7 66.6 96.1 100 85.9 ...
## $ lstat: num 4.98 9.14 4.03 2.94 5.33 ...
## $ tax : num 296 242 242 222 222 222 311 311 311 311 ...library(AppliedPredictiveModeling)
library(caret)
transparentTheme(trans = .9)
theme1 <- trellis.par.get()
theme1$plot.symbol$col = rgb(.2, .2, .2, .4)
theme1$plot.symbol$pch = 16
theme1$plot.line$col = rgb(1, 0, 0, .7)
theme1$plot.line$lwd <- 2
trellis.par.set(theme1)
featurePlot(x = BostonHousing[, regVar],
y = BostonHousing$medv,
plot = "scatter",
layout = c(3, 1))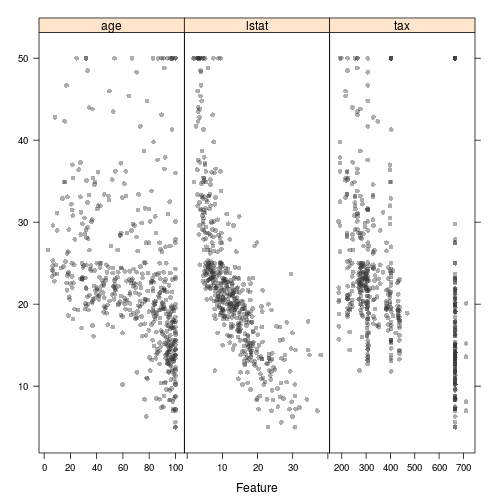
featurePlot(x = BostonHousing[, regVar],
y = BostonHousing$medv,
plot = "scatter",
type = c("p", "smooth"),
span = .5,
layout = c(3, 1))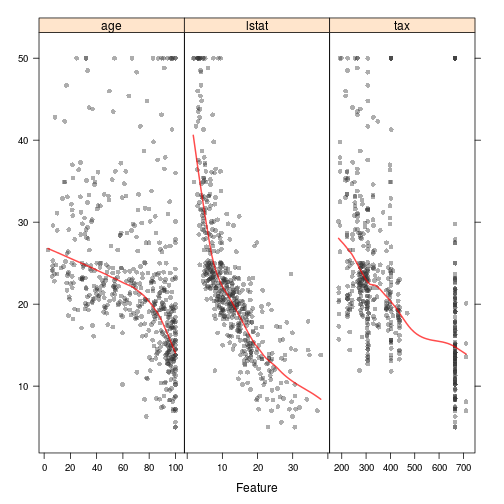 ## 引用
## 引用